Companies running many solar plants often log in to a separate portal for each inverter brand. Underperformance is noticed days later, and the lost kWh never come back. Our system pulls data from different inverter brands into one dashboard, compares expected and actual yield and raises alarms on deviation. Faults, maintenance and panel cleaning become work orders, and investors see monthly reports in their portal.

O&M problems
- A separate portal for every inverter brand
- Yield drops noticed too late
- Maintenance and cleaning planned by hand
- Investor reports prepared manually
Modules
Multi-plant dashboard
Live power, daily yield and status of all plants.
Inverter integration
Automatic data from manufacturer cloud APIs.
Performance ratio
Expected vs actual yield with deviation alarms.
Faults and work orders
Alarms become jobs assigned to technicians.
Cleaning and maintenance plans
Scheduled maintenance and panel cleaning.
Investor portal
Monthly yield and revenue reports, documents.
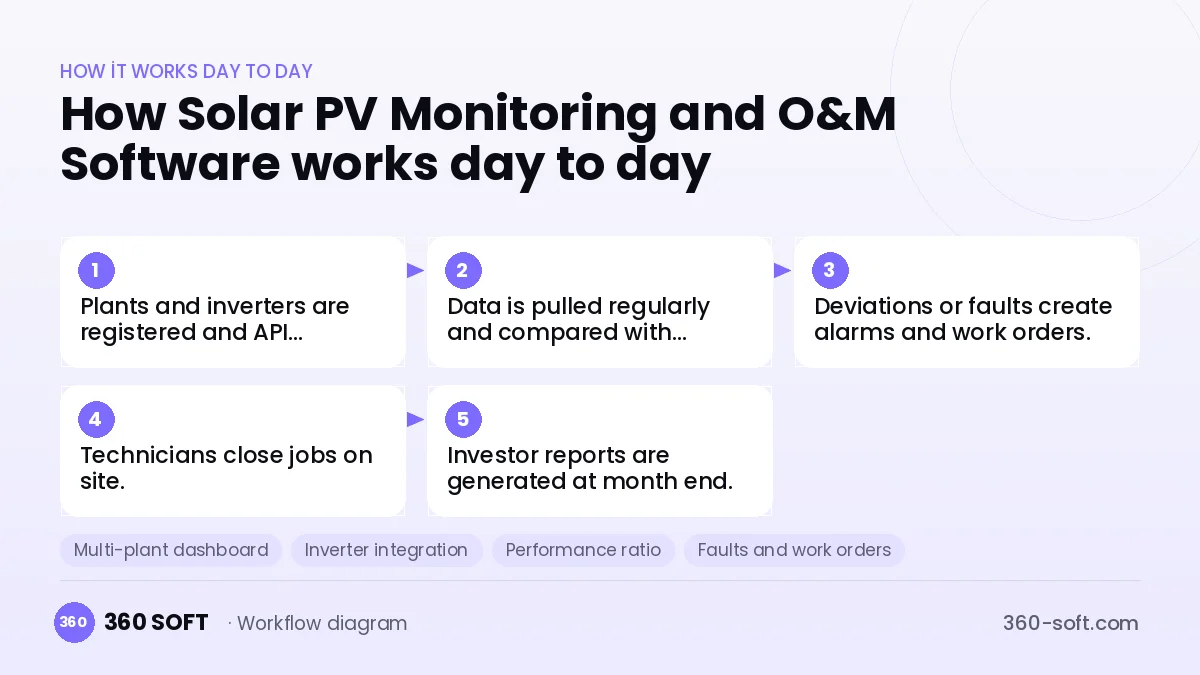
How it works day to day
- 1
Plants and inverters are registered and API connections set up.
- 2
Data is pulled regularly and compared with expected yield.
- 3
Deviations or faults create alarms and work orders.
- 4
Technicians close jobs on site.
- 5
Investor reports are generated at month end.
Integrations
Off-the-shelf software or custom-built?
When off-the-shelf is enough
Operators with one inverter brand and few plants may manage with the manufacturer’s portal.
When custom software pays off
O&M companies running many multi-brand plants reduce yield losses and reporting effort with one custom dashboard and alarms.
How the budget is built
We launch the workflow that saves you the most time first, then add modules based on real usage. The full scope below is calculated with 16 screens and 8 modules; the final price follows a free discovery call and a written scope.
Maintenance and improvements (optional): €500 / month. Hosting, SMS, WhatsApp and app store fees are listed separately.
Frequently asked questions
Which inverter brands are supported?
Those with cloud APIs; the list is confirmed for your plants during discovery.
How is expected yield calculated?
From capacity, location, tilt and irradiance data.
Can rooftop systems be included?
Yes, grouped in the same dashboard.
Can investors use mobile?
Yes, the investor portal is mobile-friendly.